
China's National Bureau of Statistics holds a press conference on January 17, 2024. In Beijing (©Kyodo)
Chinese Premier Li Qiang spoiled the announcement of China's 2023 Gross Domestic Product (GDP) growth at the World Economic Forum in Davos. Catching up quickly, the Chinese National Bureau of Statistics announced the same figure, 5.2% on the following day. However, using China's own official data, and an "expenditure method," we came to an astonishing result: instead of 5.2% growth, China's 2023 GDP fell by 4.9% or even 9.5%!
Step by step, the following is how this result was derived.
Calculating GDP by 'Production Method' vs 'Expenditure Method'
First of all, it should be noted that there are different ways of calculating GDP.
The Chinese Communist Party (CCP) adopts the so-called "production method." That means the method of first calculating the total output of each national economic sector separately. Then the intermediate consumption of each sector is deducted. And finally, the added value of the output of all the sectors is summed up.
On the other hand, the United States and major Western economies mainly adopt the "expenditure method." This method adds up consumer spending, investment, government expenditure, and net exports.
'Keqiang Index'
As to the credibility of CCP's GDP figures, even former Chinese Premier Li Keqiang himself didn't believe them. That is why he proposed three indicators. Namely, electricity consumption, rail freight volume, and bank loan disbursement. Those, he thought, should be used to measure the economic situation. This is how the so-called "Keqiang Index" came about.


Working out China's GDP
Since the CCP's official data is not reliable, we can try to calculate China's GDP by using the "expenditure method." This involves adding up consumer spending, investment, government expenditure, and net exports.
These data, the trade surplus formed by goods + services, can be found directly on the official websites of the CCP's General Administration of Customs and the Administration of Foreign Exchange.
The "fixed asset investment data" is released by the CCP's National Bureau of Statistics every month. It is not very different from capital formation, so we can use this data as it is available.
Trade Surplus
A Chinese economist named Lao Man has collected China's trade surplus and fixed asset investment data from 2008 to the present. And using those, I have compiled the following table in English based on his figures.

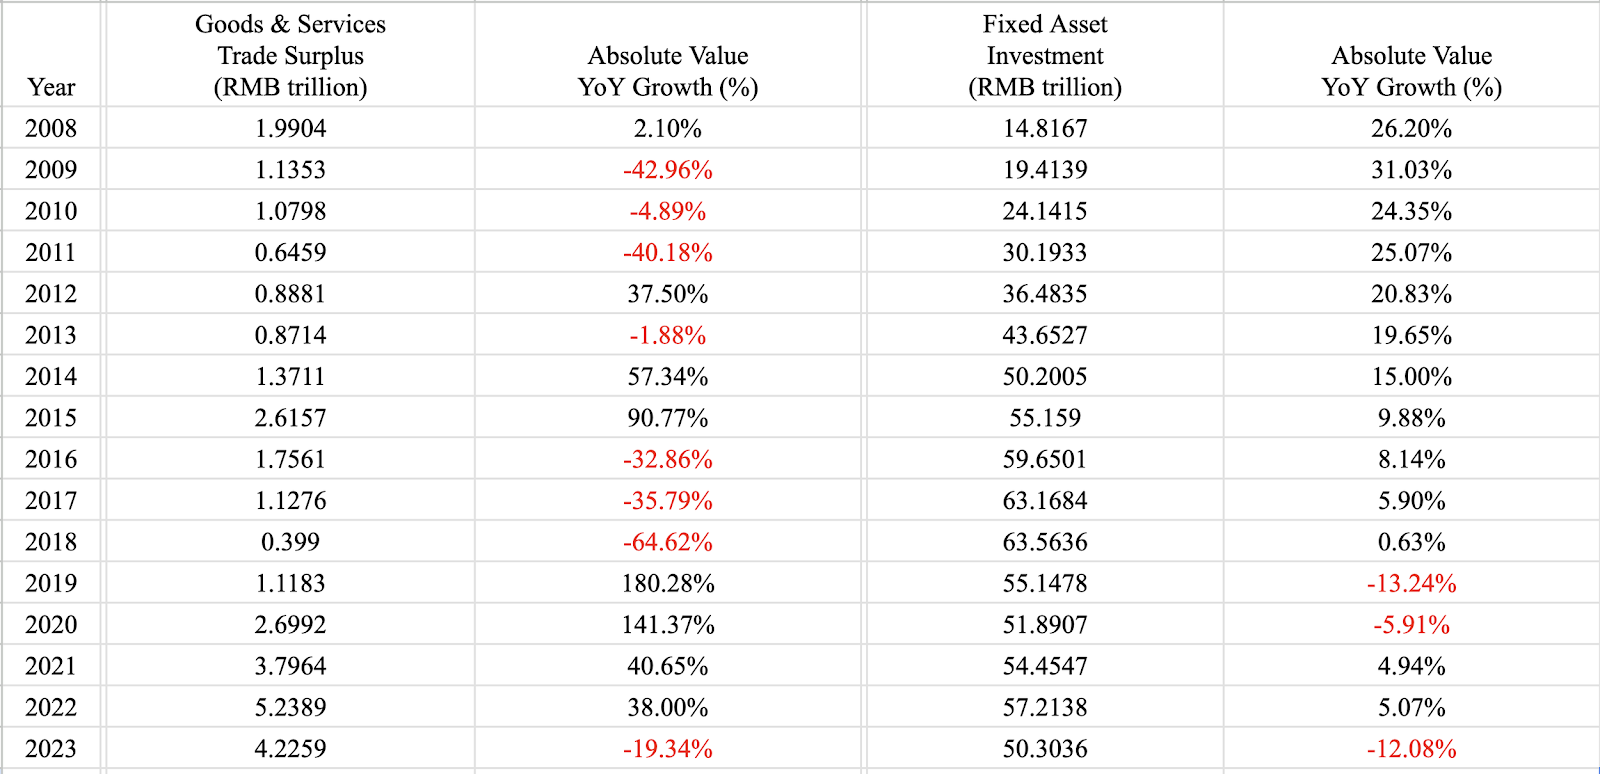
From this table, we can see that China's trade surplus has changed a lot. Between 2016 and 2018, there was a continuous and substantial decrease, followed by a recovery in growth.
In 2023 there was a decrease in the scale of goods exports and a recovery in the outbound travel of Chinese people. Therefore, the surplus once again experienced a significant year-on-year decline, with a decrease of 19.34%.

Fixed Asset Investment
China's fixed asset investment reached an all-time peak of ¥63.56 trillion RMB ($8.86 trillion USD) in 2018. It has been in contraction mode ever since. In 2023, it was ¥50.3 trillion RMB ($7.01 trillion USD), with a year-on-year (YoY) contraction of about 12%.
However, the CCP's National Bureau of Statistics has announced a positive 3.0% increase in fixed investment for 2023.
I have checked this data and it is indeed ¥57.2138 trillion RMB ($7.98 trillion USD) in 2022 and ¥50.3036 trillion ($7.01 trillion USD) in 2023. Therefore, there is a 2% decrease in investments in 2023 compared to 2022. Why the CCP's National Bureau of Statistics would get it wrong is beyond me.
Let's come back to the above table. It shows the size of fixed asset investment in 2023 has regressed to the level of 2014.
Furthermore, it shows that Chinese people's enthusiasm for investment has dropped dramatically. There is only one reason for this. More and more Chinese people have seen that although the CCP has shouted a lot of slogans to save the Chinese economy, the hand on people's necks has never been relaxed.
On the contrary, it has increased its strength. People are almost suffocated.
That is to say, people can't see any sign of economic improvement, so why should they invest?
Consumption Expenditure
Now let's look at the consumption data.
In theory, consumption consists of two parts: private consumption and government consumption.
However, Chinese government consumption is not based on market-oriented principles. It's more characterized by power and money transactions.
In other words, Chinese government spending can be defined as insider trading, related transactions, or even under-the-table transactions. It involves shadowy deals, rather than genuine market transactions.
For this reason, when calculating the actual GDP, Lao Man chose not to include government consumption in it.
As to private consumption, Lao Man chose to use the total population data and official "per capita consumer spending" data to work it out.
China's per capita consumer spending includes all aspects of people's expenditures, such as clothing, food, housing, transportation, education, healthcare, communication, etc. Therefore, to calculate this way is reasonable.

These are the figures for private consumption from 2008 to 2023.
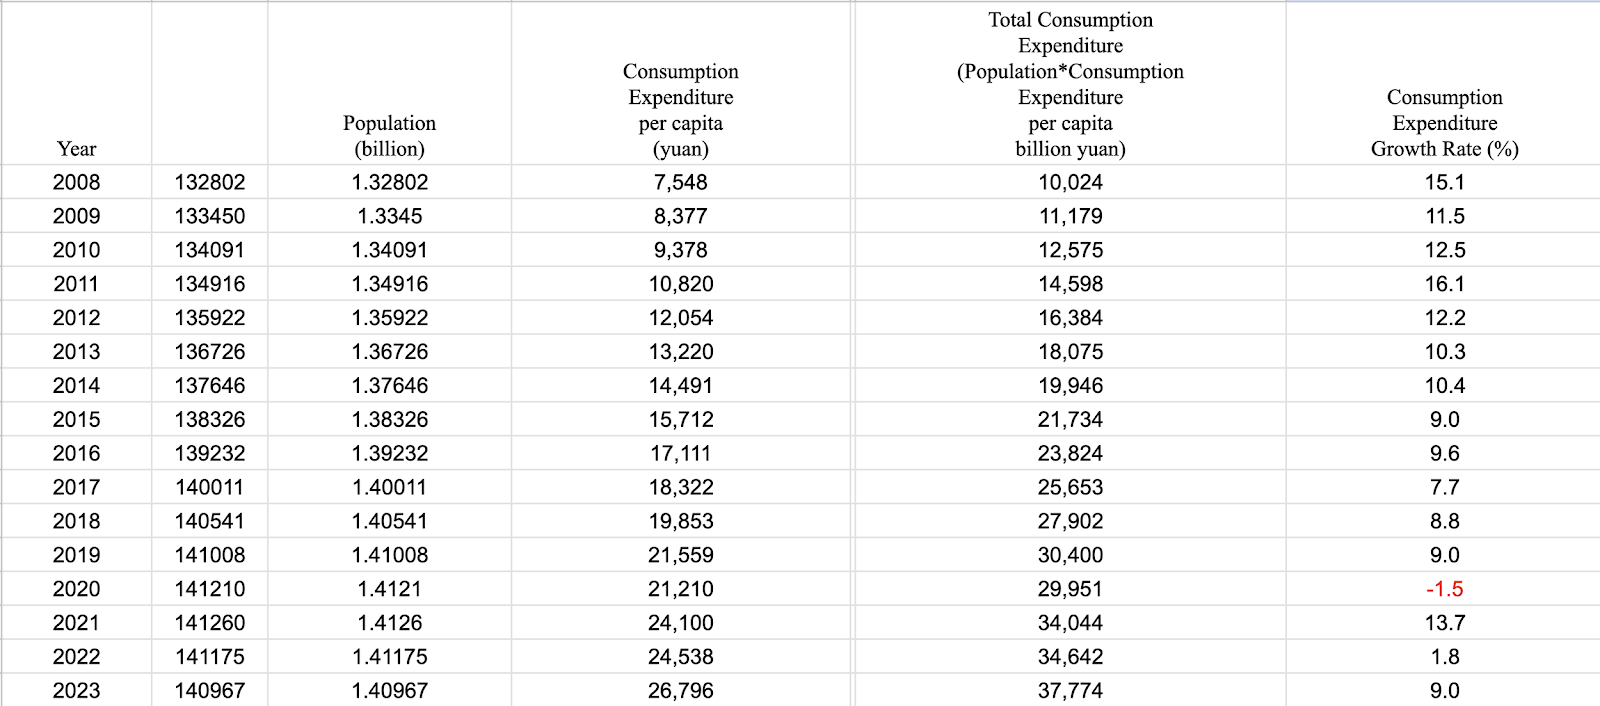
In terms of consumption growth, it was 1.8% in 2022 and 9.0% in 2023.
This increase is easy to understand. In 2023, after the CCP lifted its harsh "Zero COVID" lockdowns, people traveled more. Therefore, consumption increased over 2022 levels.
Let's assume for a moment that the numbers released by the Chinese government are correct. However, in fact, the real numbers could be much smaller than that.
For example, take the population figures. The Chinese government announced that the population only decreased by 2.08 million in 2023 and that the population was still 1.40 billion. But, in fact, as I've reported before, China's real population may only be 1 billion.
But let's assume for a moment that the Chinese government's numbers are all correct, and do the math that way.
So the consumption figures in the table above are derived by multiplying the government's population figures by "per capita consumer spending".
China's 'Actual GDP' vs Official Figures
Next, we add up the trade surplus, fixed asset investment, and private consumption. Then we will arrive at relatively realistic GDP data that reflects the actual state of affairs in China.
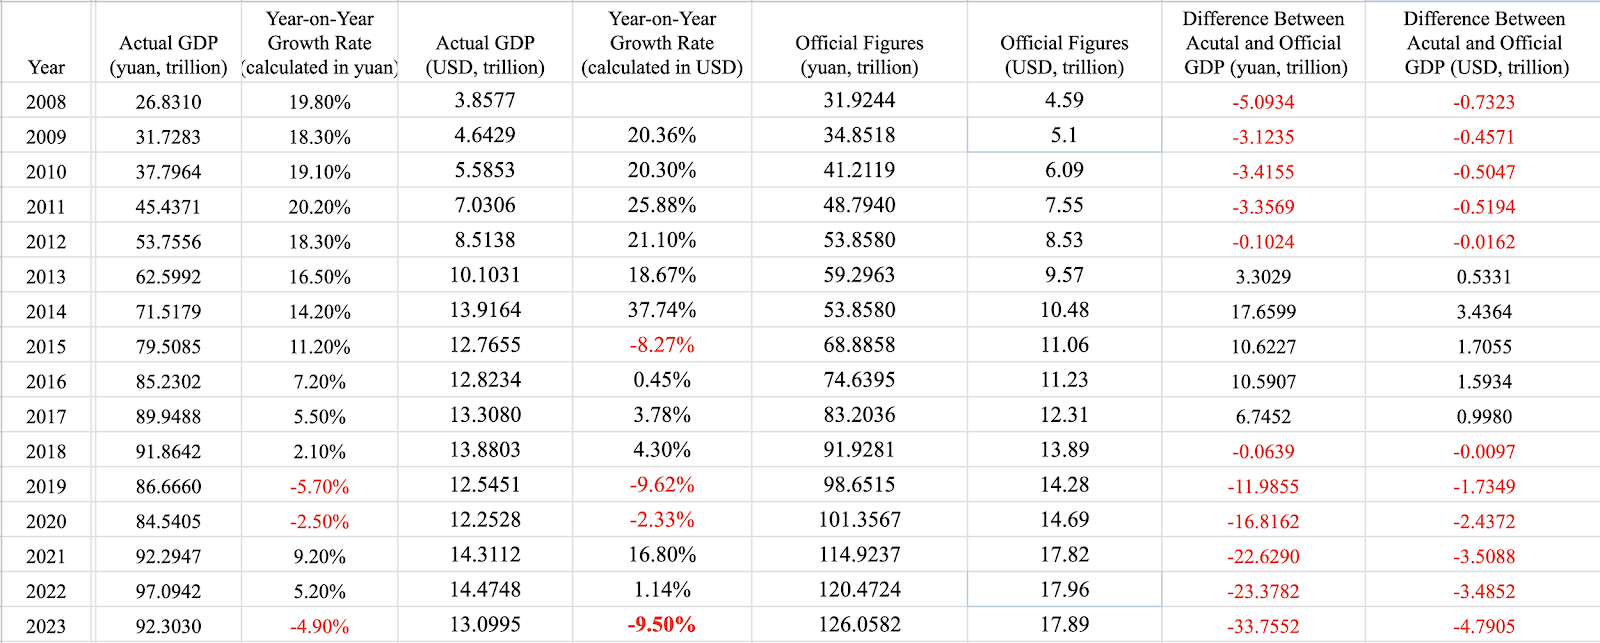
Lao Man calls this number the "Actual GDP" to distinguish it from the official GDP released by the CCP's National Bureau of Statistics.

What This 'Actual GDP' Means
Lao Man only published the actual GDP that he calculated. I checked out the official figures and listed them in the table as well so that we can make a comparison.
Also, according to the official GDP values in Chinese yuan/RMB and USD, I have converted the "actual GDP" calculated by Lao Man into USD figures for each year and listed them in it.
As shown in the table, China's actual GDP was in a state of high growth until 2015.
After that, the growth rate slowed down rapidly.
In 2019 and 2020, it was negative for two consecutive years.
This is in line with the actual feelings of the Chinese people. In these two years, the US-China trade war and the COVID lockdowns caused great damage to the Chinese economy.
In 2021, China's lockdown measures were relaxed to a certain degree, and the production order was restored. Therefore, the economy experienced a wave of recovery.
However, in 2022, the lockdowns intensified again, so the actual GDP growth rate started to go down again.
In 2023, everything seemed to be game over, so to speak.
The confidence of the people has been completely destroyed.
China's relations with the United States, Europe, and some other nations have dropped to a freezing point.
Many countries around the world have begun to decouple from China. They are withdrawing their supply chains and investments.
Under these circumstances, China's GDP growth of course logically went down to minus 4.9%.
This is the GDP growth rate that corresponds to the actual feeling of the people. The economy has entered a cold winter. Even careers like delivery have reached saturation.
Why Isn't the Official 5.2% Growth Rate Credible?
As for the 5.2% GDP growth announced by the CCP National Bureau of Statistics, I wonder how many people believe it.
The data for two of the three major components of GDP, trade surplus and investment, fell by 19.3% and 12.1% respectively, both in double digits.
At the same time, in 2023, the government as a whole was also tightening its belt due to fiscal constraints. It was drastically cutting administrative spending, so government consumption was not growing at all.
Therefore, unless the growth rate of private consumption exceeds 20%, it is absolutely impossible to pull GDP growth back to above zero under the circumstances of a 19.3% and 12.1% decline in trade surplus and investment respectively. Anyone with primary school-level mathematical knowledge can reach this conclusion.
Let's emphasize again that the trade surplus, investment, and private consumption figures we used to calculate China's actual GDP are all official data.
Government consumption is not included. However, since we are mainly concerned with the GDP growth rate in this article, rather than the absolute value, the trend it reflects is reliable.
The Differences Between Actual and Official Numbers
Now let's compare the actual GDP worked out with the "expenditure method" with the official figures.
From 2008 to 2012, the actual figures were lower than the official figures, but the differences weren't too big, from 5 trillion to 0.1 trillion.
From 2013 to 2017, the actual GDP figures calculated using the expenditure method were even greater than the official numbers.
This shows that the GDP calculated using the expenditure method is not always smaller than the official figures. In 2014, it was even more than ¥17 trillion RMB ($2.37 billion USD) higher than the official figure.
Therefore, the expenditure method does not have a so-called "systematic bias" that will underestimate GDP.
In the six years from 2018 to 2023, the gap between the actual figures and the official figures grew wider and wider. Then in 2023, it was more than ¥33 trillion RMB, or about $4.79 trillion USD.
What does this indicate?
It shows that the actual economic situation in China is rapidly declining. Therefore, the scale of fraud also has to be rapidly increased to maintain the so-called 5% growth target.
China's Actual GDP Growth in USD: -9.5%
By the way, the decline in China's GDP in 2023, if it is denominated in US dollars, is minus 9.5%, not minus 4.9%. That is due to the changes in the ratio of the renminbi to the US dollar.
This is China's real GDP.
China's GDP vs United States' GDP: 49%
Lastly, the United States' GDP in 2023 is estimated to be around $26.85 trillion USD. So if China's actual GDP is $13.09 trillion, then China's GDP is only about 49% of the United States, which makes it lower than anything anyone has ever talked about before.
RELATED:
- China Watch: Deja Vu All Over Again as a New Year Under Xi Jinping Begins
- The Truth Behind China's Unemployment Data and Its Global Impact
- Many Chinese are Mourning Li Keqiang and It's Important to Understand Why
- Weakness in China's Economy Threatens the Global Economy
Author: Jennifer Zeng
Find articles by Jennifer Zeng on JAPAN Forward. Follow her on X (formerly Twitter) and on her blog page, Jennifer's World.


